The orthopedic market North America and the Asia-Pacific region represent the two most strategically important geographies in the global orthopedic devices industry—but they differ sharply in structure, pricing, regulatory systems, and growth potential.
For manufacturers, OEM/ODM partners, and distributors aiming for global expansion, understanding the North America vs Asia orthopedic market comparison is essential for making informed investment, product, and regulatory decisions.
This article is part of our comprehensive guide to the global orthopedic sector. Below, we explore both markets in depth and provide a structured comparison across key dimensions.
🌎 North America Orthopedic Market: Scale, Maturity, and Premium Dynamics

💰 Market Scale and Maturity in the Orthopedic Market North America
The orthopedic market North America, dominated by the United States, remains the largest and most mature orthopedic market globally. In 2026, total revenues are estimated at USD 23–25 billion, accounting for approximately 38–40% of global orthopedic device revenues.
The market is defined by several key characteristics:
- 🏥 High procedure volumes
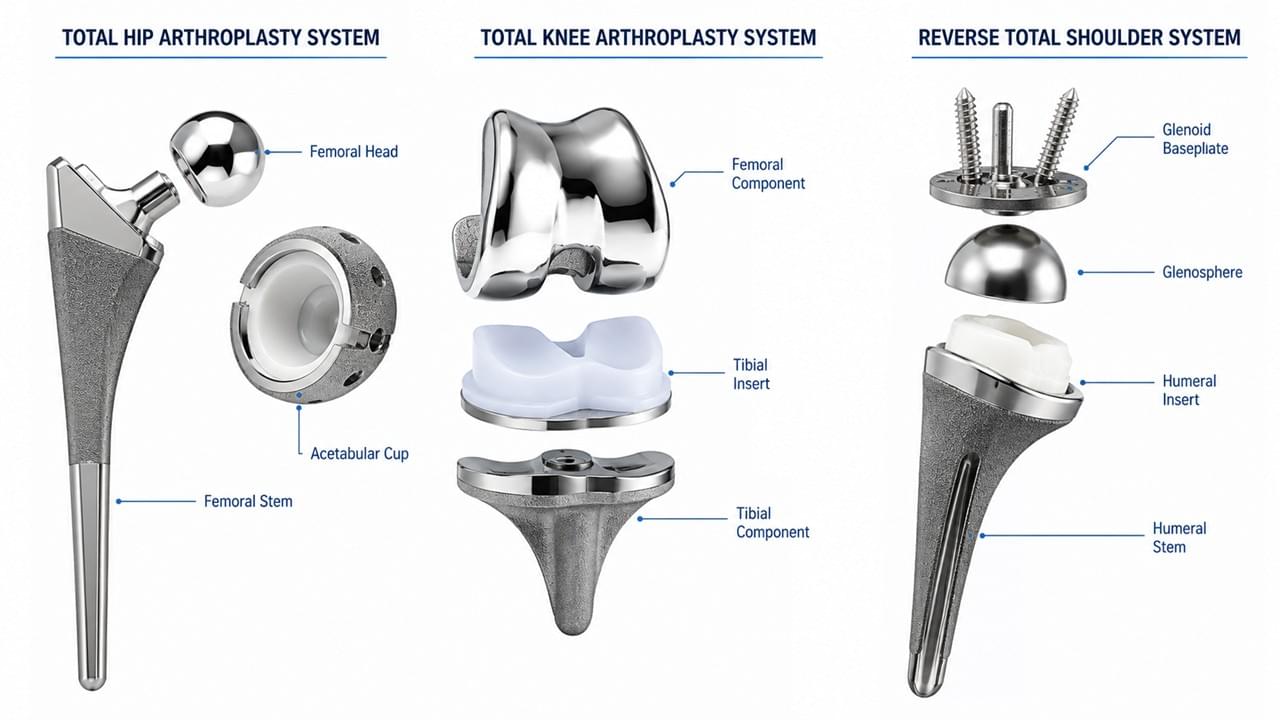
Approximately 1.2 million total hip replacements and 1.4 million total knee replacements are performed annually in the United States, reflecting a well-established surgical infrastructure. - 💎 Premium product preference
Surgeons and hospitals strongly favor established implant systems backed by long-term clinical evidence, making brand reputation a critical success factor. - 📦 Consignment-based distribution model
Most implant companies maintain inventory directly within hospital facilities, creating a capital-intensive distribution model that requires significant working capital. - 💳 Complex reimbursement landscape
Device purchasing decisions are influenced by Medicare DRG reimbursement rates, private payer contracts, and bundled payment initiatives.
These factors make the orthopedic market North America highly profitable but also highly competitive and operationally demanding.
🧾 FDA Regulatory Framework in the Orthopedic Market North America
Accessing the orthopedic market North America requires compliance with the U.S. FDA’s rigorous regulatory pathways:
- ⚙️ Class II devices (510(k))
Most trauma implants and many joint systems fall under this category, requiring demonstration of substantial equivalence to an existing predicate device. - 🧪 Class III devices (PMA)
Novel implants require full clinical investigation and premarket approval. This pathway typically costs USD 1–5 million+and takes 3–7 years. - 🔍 De Novo pathway
Applicable to innovative devices without a predicate but classified as low-to-moderate risk.
👉 External reference: FDA Medical Devices
🏭 OEM Opportunities in the Orthopedic Market North America
Despite dominance by large multinational brands, OEM and private-label opportunities remain viable:
- 🔧 Surgical instruments and accessory systems
- 📦 Sterilization trays, packaging, and logistics components
- 💡 Value-tier implant systems targeting ambulatory surgical centers (ASCs)
- 📉 Generic trauma implants competing in group purchasing organization (GPO) channels
These niches allow smaller or cost-focused manufacturers to enter the orthopedic market North America without directly competing at the premium tier.
🌏 Asia Orthopedic Market: High Growth with Structural Complexity

📈 Asia Orthopedic Market Growth Trends and Regional Drivers
The Asia orthopedic market generated approximately USD 13–14 billion in 2026, with a projected CAGR of 7–8% through 2030, significantly outpacing North America.
Five countries account for the majority of regional demand:
| Country | Est. 2026 Revenue | Key Growth Driver |
| China | USD 5–6B | Volume expansion, VBP reform |
| Japan | USD 2.5–3B | Aging population |
| South Korea | USD 1.2–1.5B | Advanced technology adoption |
| India | USD 1.5–2B | Healthcare infrastructure expansion |
| Australia | USD 0.9–1.1B | Premium procedures |
These figures reflect strong Asia orthopedic market growth trends, driven by demographics, policy reform, and expanding healthcare access.
⚖️ Orthopedic Device Regulatory Differences: FDA vs Asia Orthopedic Market
A defining feature of the North America vs Asia orthopedic market comparison is regulatory diversity.
- 🇨🇳 China (NMPA)
Class III implants require registration processes lasting 3–5 years. The Volume-Based Procurement (VBP) program has reduced implant prices by up to 80–90%, accelerating domestic market share gains. - 🇯🇵 Japan (PMDA)
Often requires local clinical data (“bridge studies”), with approval timelines typically 12–18 months longer than FDA. The market strongly favors proven, premium products. - 🇮🇳 India (CDSCO)
Regulatory requirements have strengthened under Medical Device Rules 2017. The market remains price-sensitive but offers rapid growth potential through distributor-led entry. - 🇰🇷 South Korea (MFDS)
Known for rapid adoption of advanced technologies such as robotics and navigation systems. Requires ISO 13485-compliant quality systems.
👉 External reference: WHO Medical Device Guidance
⚔️ North America vs Asia Orthopedic Market Comparison
 💸 Orthopedic Market Pricing Differences and Strategic Impact
A critical insight in the North America vs Asia orthopedic market comparison is the substantial pricing gap:
- 🇺🇸 United States: Titanium interlocking nail = USD 350–450
- 🇨🇳 China (VBP): USD 40–80
- 🇮🇳 India: USD 80–120
🔍 Strategic Implications:
- ⚙️ Cost structure divergence
Asia-Pacific markets require lean manufacturing and lower overhead structures compared to North American cost models. - 🧩 Product design adaptation
Simpler, durable implant systems often outperform complex, high-cost solutions in emerging markets. - 📊 Regulatory investment ROI
FDA approval costs are justified by premium pricing, while Asia requires market-specific ROI calculations.
Understanding these orthopedic device regulatory differences FDA vs Asia is key to sustainable profitability.
🏗️ OEM Opportunities in the Asia Orthopedic Market
The Asia orthopedic market presents broader and more flexible OEM/ODM opportunities:
- 🇨🇳 China
Dual-channel strategy: VBP-driven public hospitals and premium private hospitals - 🇮🇳 India
Strong demand for cost-efficient manufacturing partnerships serving domestic and export markets - 🌍 Regional export hub
Asia-based manufacturers with FDA/CE certifications increasingly act as global supply partners for international brands
❓ FAQ: North America vs Asia Orthopedic Market
Q1: Which market is larger?
North America leads in total size, while Asia-Pacific shows faster growth.
Q2: Which region has more complex regulations?
The FDA is centralized but rigorous; Asia involves multiple regulatory systems, increasing overall complexity.
Q3: Can FDA approval support entry into Asia?
Yes, but it does not replace local approvals. It can accelerate review processes in certain countries.
Q4: What is the impact of China’s VBP policy?
It has significantly reduced implant prices in public hospitals, reshaping competitive dynamics.
Q5: What is the best Asia-Pacific entry strategy?
Begin with FDA/CE certification, expand through distributors, and treat China as a separate strategic market.
✅ Conclusion
The orthopedic market North America and the Asia orthopedic market offer fundamentally different opportunity profiles. North America provides premium pricing and high procedure volumes but requires sophisticated regulatory navigation and capital-intensive distribution. Asia-Pacific offers the highest growth rates globally but demands multi-system regulatory compliance, price-optimized product design, and distributor-dependent market entry.
The most successful orthopedic manufacturers operate in both regions with tailored strategies — premium product lines for North America, cost-optimized certified products for Asia-Pacific. For the full strategic context, return to our main guide: Global Orthopedic Devices Market.
Considering entering North American or Asia-Pacific orthopedic markets? Contact our team for regulatory strategy and distribution partnership guidance.